Lesson
2.6.1
Goal: Given a point and a linear inequality, determine whether the point is a solution.
A linear inequality is comprised of the inequality and several variables and integers.
The Blue Arrows indicate Integers, Red arrows indicate the
variables and the Green arrows indicate the inequality.
In order to graph the linear inequality, it must be rewritten
into the slope-intercept from. (y = mx + b)
Y ≤ ![]() x + 4 2x –
5y > 10
x + 4 2x –
5y > 10
Correct Incorrect
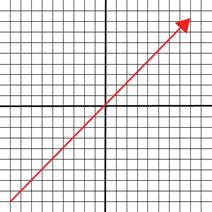
Graphing a linear inequality follows the same basic steps
of a linear equation by finding the y-intercept and then plotting the slope. But
when plotting the line, the different inequality signs change the meaning of
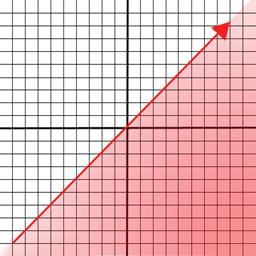
the line. Greater than (<) and less than (>) signs cause the boundary
line to be dotted. While the greater than or equal (≤) or the less than
or equal (≥) causes the boundary line to be solid.
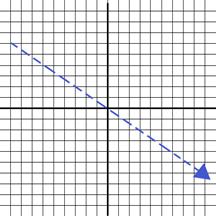
(<)
or (>) are dotted (≤) or (≥) are solid
Now that the boundary line has been determined the next
step is to see if a given point or multiple points are a solution to the
inequality. By using the boundary lines we can tell which points are parts of
the solution.
If the point is a solution to a (<) or (>) inequality
then the side the point is on is to be shaded. When the point of a (≤) or
(≥) inequality is on the shaded area or the line then it is a solution to
the inequality.
Example: Solve and graph the inequality in a coordinate plane.
(-2x) + 4y ≤ 2
Step One)
Get the inequality into slope intercept
form
First step is to move the -2x to the other side. Next get (y) by itself.
(-2x) + 4y ≤
2
+2x +2x
4y ≤
2x + 2
![]() ≤
≤ ![]()
y ≤ ![]() x +
x + ![]()
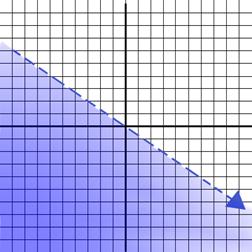
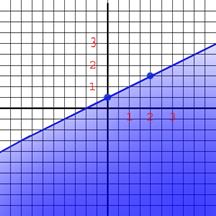
Step Two) Graph the inequality
First is to graph the
line of the inequality which will be solid because its (≤) Then use the test point
(0,0) to see which side is to be shaded.
(Practice Problems) Graph the inequalities in a coordinate plane.
(A.)
-y ≥ -x + 4 (B.) 4+ 2y ≤
6x + 2